ICICI Direct has retired its old watchlist. How is the new watchlist different from the older one? Let’s have a look at the disadvantages of the latter:
Popup: Whenever the user clicked on the watchlist option, ICICI Direct website opened a popup instead of a new page with your scrips. To be honest, it is very difficult to switch between the browser tab and a popup.
Slow: Although the popup I’ve described above had a search box, this box generated the dropdown list containing the names of the scrips slowly. If you have an account with Zerodha, you may know how fast Zerodha generates the dropdown list containing the names of the the stocks containing the text you’ve entered in the search box.
Chart loading time: Although ICICI Direct website is integrated with TradingView charts, the site didn’t open the chart quickly when you click on any instrument displayed in the watchlist.
The new ICICI Direct watchlist page overcomes the above drawbacks by offering a unified interface. The parts of this interface are as follows:
Chart
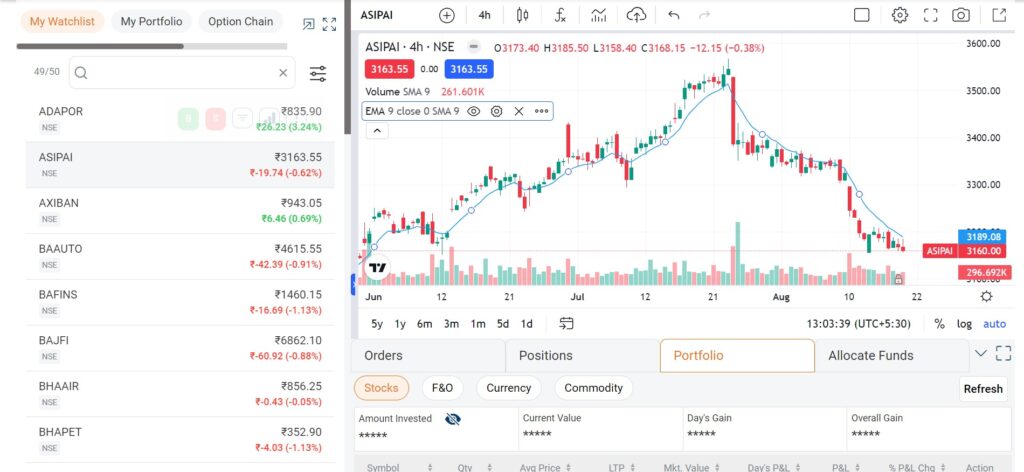
ICICI Direct uses TradingView Pro charts which not only offer premium indicators such as volume profile but also deliver better performance. The broker supports 28 chart layouts and allows users to compare multiple stock market symbols at a time. When you choose the compare option, ICICI Direct will open a line chart of the stock you’ve chosen. The broker supports these time frames – 1, 2, 3, 4, 5, 10, 15, 30 minutes, and 1, 2, 4 hours. It also supports daily, weekly and monthly timeframes. It allows you to enable buy and sell button on the chart. If you click on the button, a popup will appear. You can place an order through this popup.
Watchlist
This is one of the most interesting features of the revamped ICICI Direct watchlist interface. The watchlist has a search box with filter. When you enter a letter in this box, the website will find and display every instrument whose name contains the letter you’ve entered. This may take a few seconds. To see results quicker, you can select a category filter displayed below the search box. This filter appears when you enter a letter in the box. For example, if I want to sell an option, I will choose the filter “NFO” and enter the name of the index, stock and strike price.
In addition to the filters, I’ve mentioned above, the watchlist has these two special filters – My Portfolio and Option Chain. If you click “My Portfolio”, the website will create a watchlist containing the stocks in your portfolio. When you click “option chain”, ICICI Direct will show the option chain.
Orders
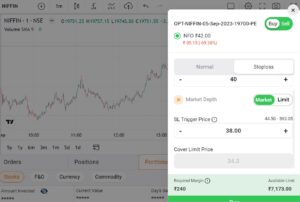
All orders created by users appear in the “orders” section. You can see the time, number of shares/lots you’ve purchased etc here. ICICI Direct allows users to place these four types of orders – delivery, intraday, MTF, and stop loss. To place an order, move the mouse cursor on an instrument and click on the green color buy or red color sell button.
Positions
All intraday positions you’ve created or closed will appear here. You can square off the order, add new instrument of the same type to the existing order from this section.
Portfolio
If you’ve bought shares earlier with ICICI Direct, you can see the performance of your scrips from the Portfolio section. Portfolio module shows the amount you’ve invested, current value of your investment, day’s gain and overall gain. The broker hides these hour details by default. To see the same, you should click on the “unhide” icon. Below the details of your portfolio, ICICI Direct website boasts the following details of a symbol:
- Name, quantity, average price.
- Latest price, market value, day’s profit/loss, percentage gain/loss.
The broker lets users square off the position from the portfolio interface itself. To close a position, right click on the three vertical dots and choose the option “sell”.
Funds
From this section, you can allocate funds for the segments you’ve activated without opening any other page of the site. You can also see the current allocation and amount that has been blocked because of your activity during the stock market hours.
The above four sections are a part of a tabbed interface that appears below the chart.
The entire watchlist section appears below the website’s header which comprises the menu bar, search box, search box, etc. You can hide this header by scrolling down a bit.
Pros
Everything in one place: The watchlist section of ICICI Direct seems to be inspired by the website’s Flash Trade module. It provides everything you need for trading or buying new shares.
Cons
Although the broker has created a great new feature, it has a few drawbacks. The search box isn’t as fast as that offered by its counterparts. The search function needs to be optimized. Some of the chart settings take some time to load.